
Visitor analytics shows you what your LeadWin agent achieved in a period: how many people visited your website, how many chatted and how many of them turned into inquiries, appointments and conversations with your team. Each number sits next to the equally long period before. This way, you see whether your changes work and which channels bring you prospects.
At a glance
- You find the page in the LeadWin dashboard under Analytics → Visitor analytics. The Analytics area opens on this page.
- The report is included in every plan, even in Free. The CSV export is available with Pro, Scale and during the trial.
- Chats and conversions are live. LeadWin calculates sessions, visit duration and sources once a night, and today is missing from them until the next morning.
- Sessions, sources and entry pages only count visitors who consented to visitor analytics.
- Owners, admins and people with the Viewer role can see the page, but not the Agent role. You set the roles under Team.

How it works
Your LeadWin agent starts counting on your website as soon as the code is installed. Feedbax does not show your visitors a consent banner of its own. You tell LeadWin under Privacy whether a visitor has consented, either for all visitors or individually through your consent tool. What LeadWin counts depends on this:
- Without consent, LeadWin only counts anonymously in daily counters: how often your LeadWin agent was seen and how often it was opened. No sessions and no visitor profiles are created.
- With consent, each visit creates a session with pages, duration, origin, device and location.
- Chats, inquiries, appointments and requests for a human are counted by the server for all visitors, with and without consent.
This is why Sessions are usually lower than the numbers in other analytics tools, while chats and conversions are complete. Not counted are your own visits, as long as you are signed in to the dashboard in the same browser, detected bots and everything from the live preview. A simulated visit under Live visitors, on the other hand, counts like a real one.
When the numbers are up to date
The page refreshes itself every 15 seconds, as the green pulsing Live at the top shows. Not every number is new right away, though:
- Immediately: LeadWin seen, LeadWin opened, Chats, Inquiries, Booked appointments and Team conversations.
- Overnight: Sessions, Conversion rate, visit duration, sources, entry pages and the stages Conversation completed and Conversation abandoned. LeadWin calculates them every night after 2 a.m. UTC for the last three completed days.
On the first day after installation, there can therefore be chats while Sessions still shows 0 and the conversion rate shows a dash. The next morning, the picture is right.
LeadWin keeps individual visit data for 90 days and aggregated daily numbers for 730 days. If you choose 90 days, the comparison period, meaning days 91 to 180, comes from these daily numbers.
Choose and compare a period
- Open Analytics → Visitor analytics.
- At the top, choose 7 days, 30 days or 90 days. The default is 30 days, counted backwards from today (UTC).
- Below each tile, read the change compared with the period before, for example vs. previous 30 days. An increase appears in green, a decrease in pink, and a change below 0.5% in grey as ±0%.
The page does not remember the period. The next time you open it, it shows 30 days again. If there was nothing to compare in the previous period, the line with the change is missing.
Read the metrics
The top row describes the traffic on your website:
- Sessions: visits from visitors with consent.
- Chats: conversations in which the visitor wrote at least one message.
- Conversion rate: the share of sessions with at least one conversion. Each session counts only once, so the value is never above 100%. If there were no sessions, it shows a dash.
- Avg. visit duration: the total time spent divided by the sessions, as minutes and seconds, and with hours from one hour upward.
The second row shows the conversions: Inquiries from the chat, Booked appointments and Team conversations, meaning a visitor's requests to talk to a human. A request counts once per conversation and only as long as the email notification is turned on in the Inbox. The Solved tile only appears if there was at least one such case in the period.

You find the individual inquiries and appointments behind these numbers in the Leads area.
View the trend
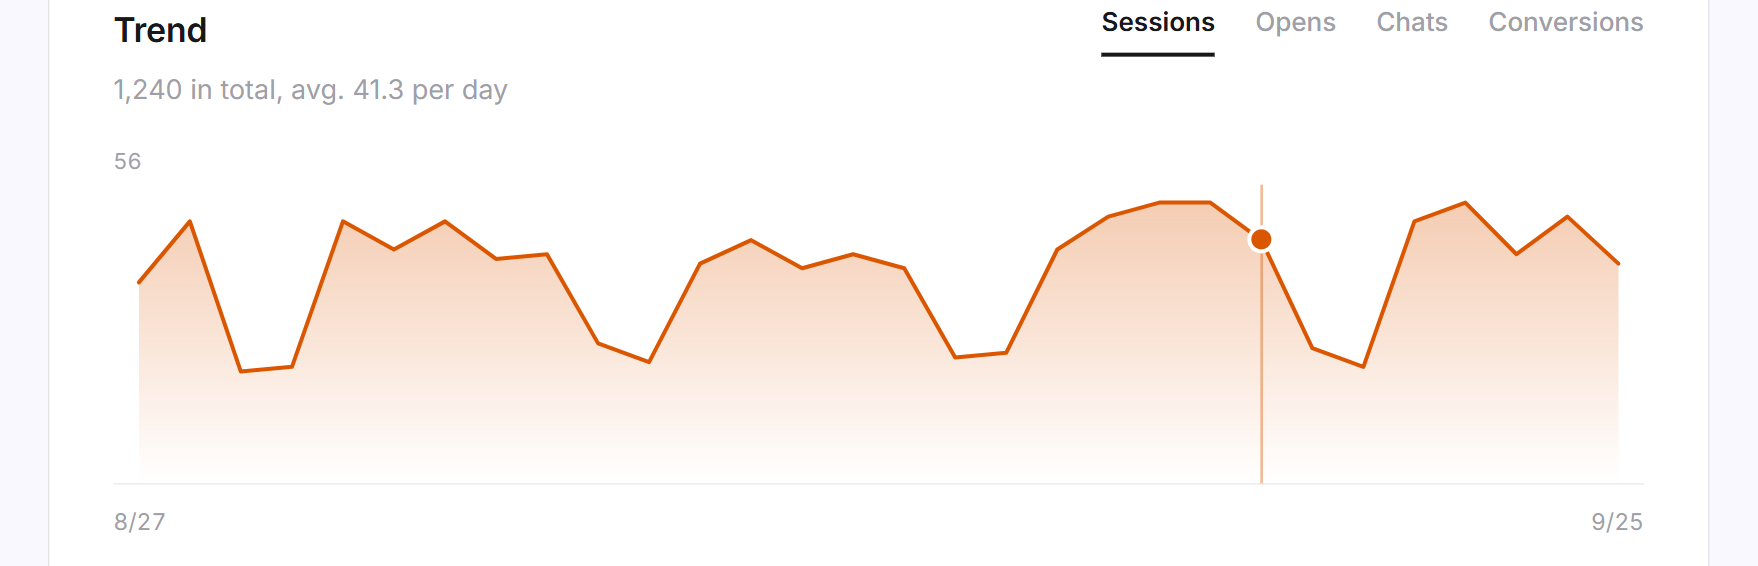
- Under Trend, choose the metric: Sessions, Opens, Chats or Conversions.
- Hover over a day to see its value.
Opens count every opening of your LeadWin agent, even without consent. Conversions are inquiries, appointments and team conversations combined. Above the area is the highest value, below it the first and last day, and in the subtitle the total and the average per day. Days without data count as 0. The trend needs at least 2 days in the period.
Read the LeadWin funnel
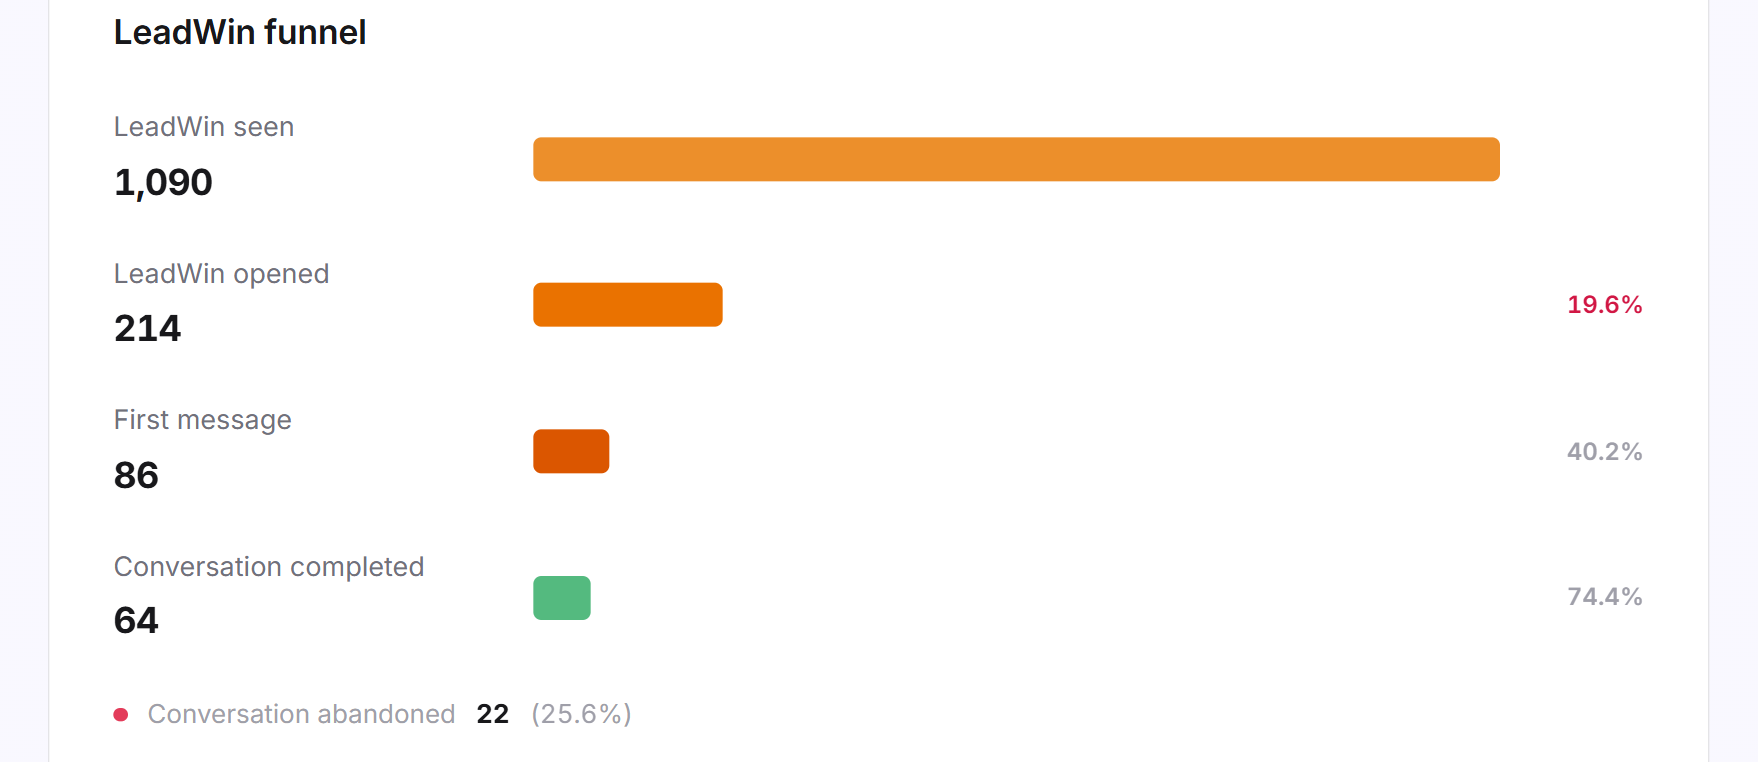
The LeadWin funnel shows how many visitors reach each stage: LeadWin seen, LeadWin opened, First message and Conversation completed. From the second stage on, it shows the share of the stage before. If it is below 25%, it is marked in pink. That is where a closer look pays off, for example at your welcome message. Below it is the number of abandoned conversations.
The browser counts the first stages, the server the later ones. If a browser blocks the signals, a later stage can be larger than the one before. The share is then capped at 100%, while the numbers themselves stay unchanged.
Proactive surfaces
If at least one surface has numbers, the Proactive surfaces card shows one row each for Speech bubbles, Trust signals and Campaigns, with Impressions, Clicks and CTR and the change compared with the previous period. Each surface counts impressions in its own way, trust signals for example per page view and not per card. So compare a surface with its own trend, not with the others. The numbers per element are on the page of the respective surface.
Sources and entry pages
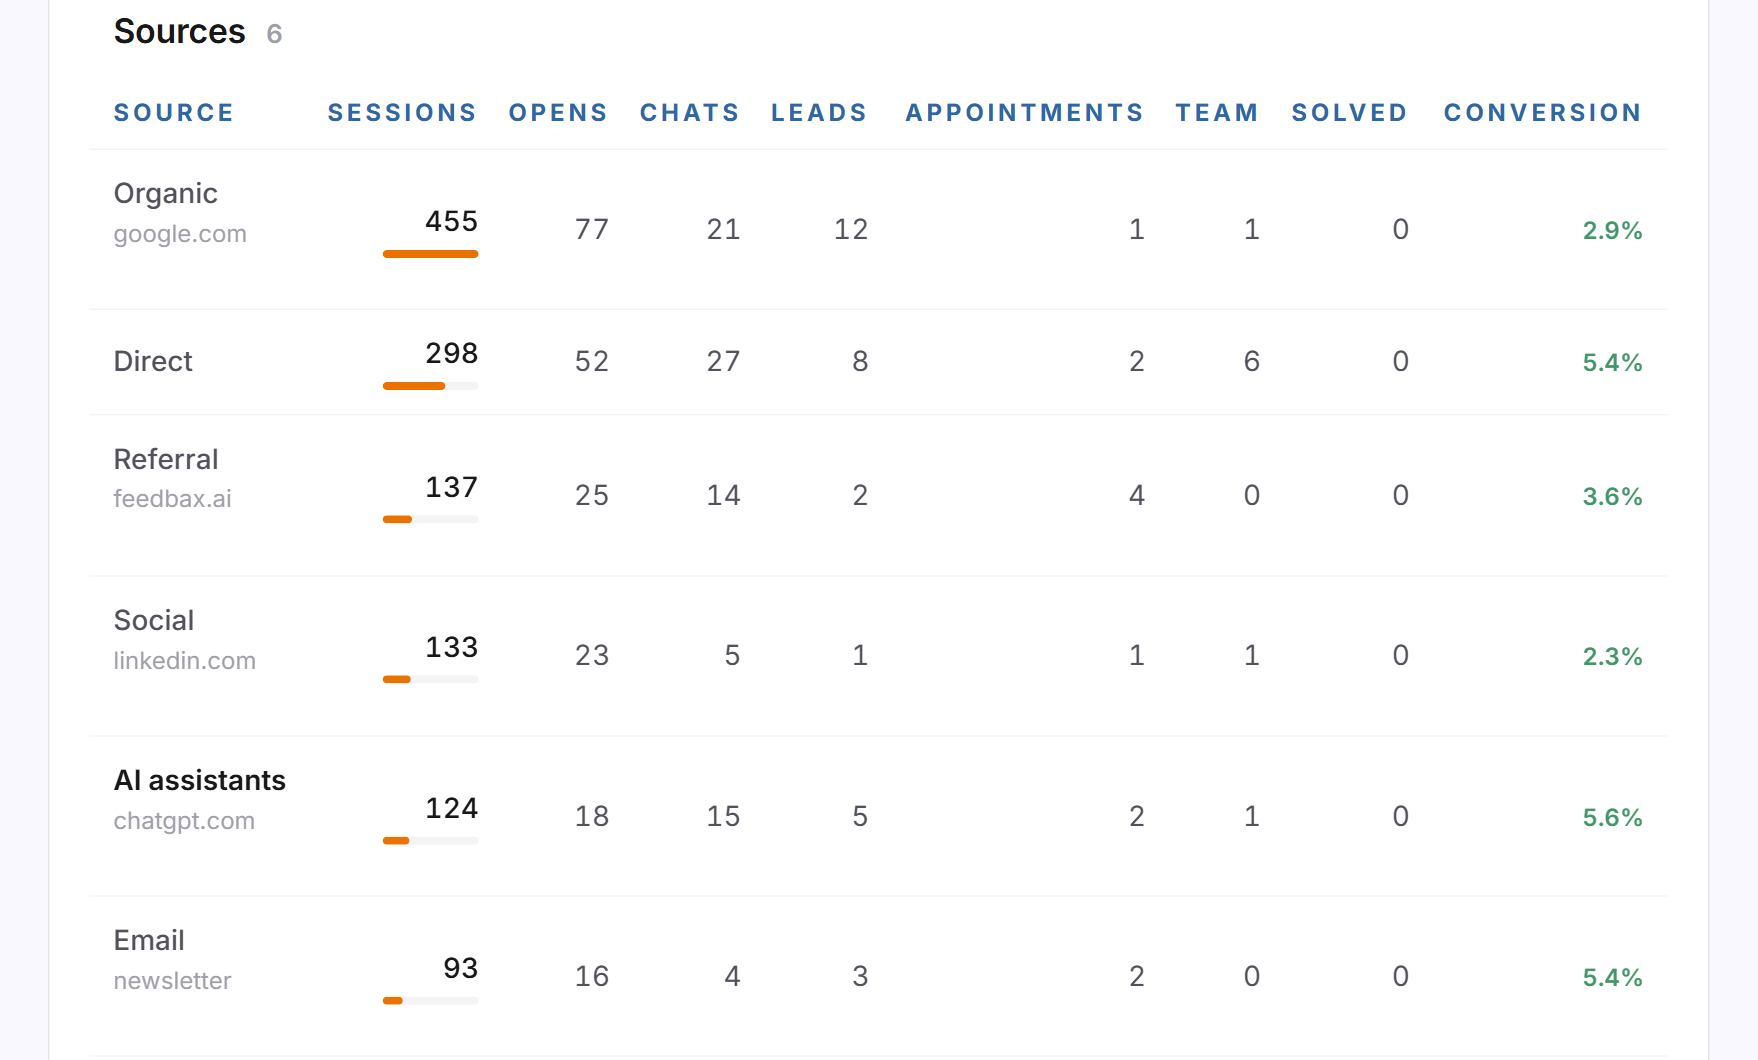
The Sources table shows where your visitors come from: Direct, Organic, Paid, Social, Email, Referral and AI assistants, each with the referring website or the UTM source. AI assistants are ChatGPT, Perplexity, Gemini, Copilot and Claude. Their rows are in bold. The Entry pages table shows the page on which visits started.
Both tables have the columns Sessions, Opens, Chats, Leads, Appointments, Team, Solved and Conversion. They are sorted by sessions and show all rows. If there is nothing yet in the period, it says No data in the selected period yet.
Export the data as CSV
- Choose the period.
- Click Export CSV at the top. The file is downloaded.
The file contains up to 10,000 sessions of the period, one row per session, only from visitors with consent. The columns are separated by semicolons, and the character encoding is UTF-8. The column names are in English: start time, channel, referring website, UTM source, UTM medium and UTM campaign, entry and exit page, page views, country, city, device, browser, returning visitor and the funnel stage reached. In Free and Basic, the button carries a lock and opens the LeadWin pricing page. With Feedbax Business it opens the Feedbax pricing page, because that is where you book the next plan up.
What your plan includes
| Plan | Visitor analytics | CSV export |
|---|---|---|
| Free | yes | no |
| Basic | yes | no |
| Pro and trial | yes | yes, up to 10,000 sessions |
| Scale | yes | yes, up to 10,000 sessions |
Feedbax Business comes with the limits of Basic, Premium with those of Pro and Enterprise with those of Scale. You find more on this in LeadWin in your Feedbax plan, and all limits in Plans compared.
Visitor analytics shows totals. Pro also shows you the individual people: who is on your website right now, who comes back how often, every event with the visitor behind it under Activity, and by email every visitor showing clear interest. During the trial, you try this out for 7 days.
Frequently asked questions
Why does Sessions show 0 although chats have already come in today?
LeadWin calculates sessions, conversion rate, visit duration and the tables overnight. Today's numbers appear tomorrow morning. Chats and conversions are there right away.
Why are my numbers lower than in Google Analytics?
Sessions only count visitors with consent. Without consent, LeadWin only counts anonymously how often your LeadWin agent was seen and opened.
What counts as a conversion?
A session with an inquiry, a booked appointment or a request to talk to your team. The conversion rate counts each session only once.
Why is a share in the funnel capped at 100%?
The browser counts the early stages, and it can block signals. The server counts the later stages. If a later stage is larger, LeadWin shows the share as 100%.
Are my own visits counted?
No, as long as you are signed in to the dashboard in the same browser. A simulated visit under Live visitors, however, is counted.
What are AI assistants in the sources?
Visitors who came to your website from ChatGPT, Perplexity, Gemini, Copilot or Claude.
Why does a person from my team not see the Analytics area?
The Agent role has no access to Analytics. Owners, admins and viewers have it.
How long is the data kept?
Individual visit data for 90 days, aggregated daily numbers for 730 days.